
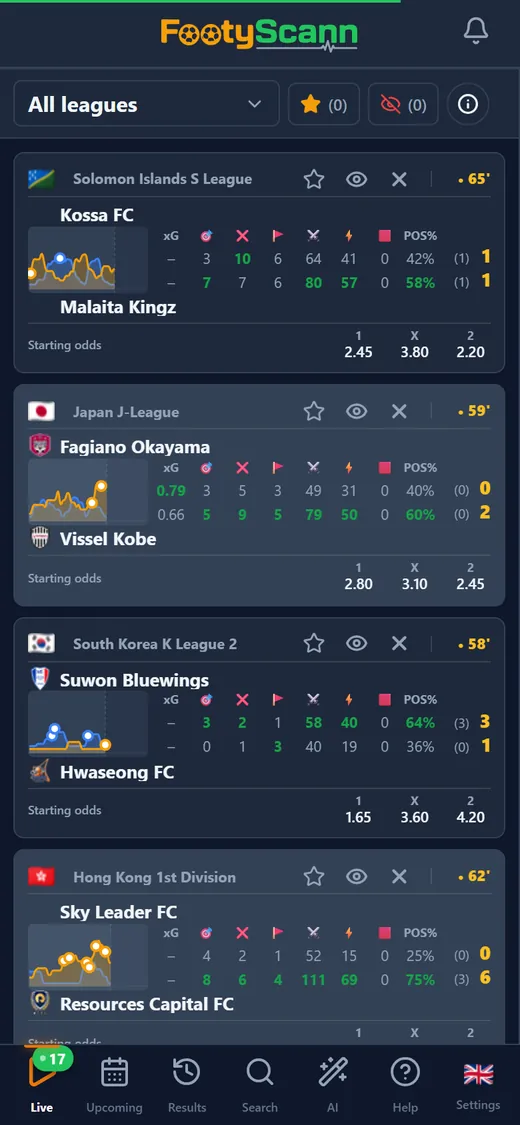
What the pressure chart shows
Every match in the live list has a small chart with two lines, one for the home side and one for the away side. For each minute, FootyScann adds up what each team did over the last few minutes of play: shots on target, shots off target, corners, possession and, when the data provider sends them, dangerous attacks. Each event has its own weight, so a shot on target counts for more than a corner, and a corner for more than a few points of possession.
The result is a lightly smoothed line that rises when a team creates chances and drops when the game calms down. A red card is added to the opponent's pressure, since a side down to ten men usually gives up ground.
The full-size chart: minute, interval and events
Tap the small chart and the full chart for that match opens. Pick a minute with your finger or the arrow keys and you get a pressure score from 0 to 100 for each team, a bar, and the events of that minute: goals, shots, corners and red cards.
If one minute is too narrow, choose a 5, 10 or 15-minute interval ending at the selected minute. All events from that stretch appear under the chart and the score becomes the average pressure across it. The line itself stays the same; only what you read below it changes.
How to read it
The chart summarises live football stats; it is not a prediction. It doesn't tell you what will happen next. It shows you, faster, what has happened so far.
- Compare the lines: when one team dominates for several minutes, its line stays on top.
- Look for swings: a line that jumps after half-time or after a substitution shows the game has turned.
- Put the score in context: a team trailing 0-1 while pressing hard tells a different story from the score alone.